River Status Dashboard
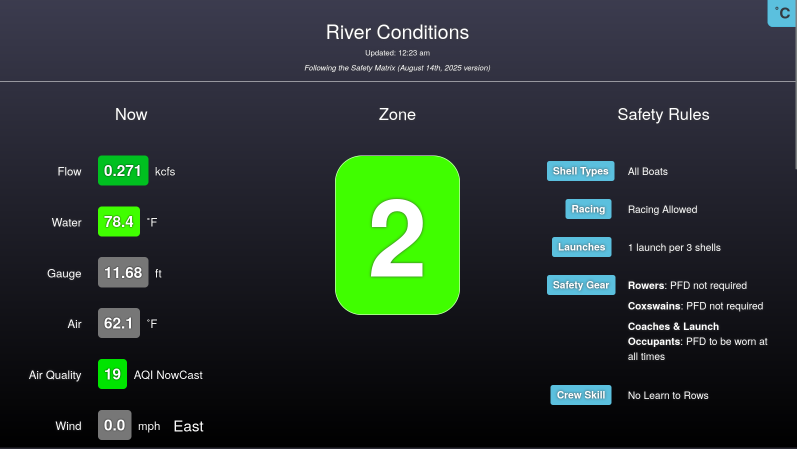
Looking for an easy, at a glance view of the river safety conditions near your boathouse? The RiverStatus Dashboard augments your water safety plan with current condition data from sources including the USGS, NOAA, and the EPA alongside your club's safety information for easy viewing at a glance.
Open DashboardInterested?
Do you think the RiverStatus Dashboard can help level up your water safety process? Fill out the survey below to let us know you are interested and start the conversation!
The Matrix
At the core of the status page is a "safety matrix" mapping conditions to "safety zones". Zones can restrict activities to keep everyone safe. Build your matrix with a template below and submit it so it can be added.
Get involved
RiverStatus is part of the OpenRowing family of community-built software projects for rowers. Come meet the community, get involved or check out other projects
History
The RiverStatus Dashboard and Safety Matrix was first created in 2018 by Max Garber for the Three Rivers Rowing Association in Pittsburgh, PA. Since then it has been expanded to allow it to be reused by any rowing club.